Determine the volume of your target market (including the different sub-markets)

Establishing our target market consists of three steps:


1. Market segmentation

Demographic segmentation: Because we are going to offer a product B2B, we targeted the market segment based on industry (IT) and company size
  • Our target market are IT corporations, with employees between the ages of 22 and 45, in the middle income group.
  • Geographical segmentation:
  • In the initial phase, we plan to launch locally, in Bucharest. Afterwards, we will extend on a global scale.
  • Behaviouristic segmentation: lifestyle, interests of the company and belief system variables
  • Complex applications where architects decide comprehensive automated testing is requried.
  • 2. Evaluation and the target-market decision

  • We focused our marketing campaigns on a specific segment (we are no longer focus also on freelancers or students and small business organizations). The choice was governed by things such as accessiblity (for advertising purposes) and size (to generate enough profits). If most customers (size) in an area have no knowledge in QA automation, it is logical to buy (accesibility) a product that may help them, as this will generate more sales and profits.
  • 3. Market positioning

    Because we want to be successful entrepreneurs, we are choosing to go for a large share in ONE segment, rather than a small share in the total market. It's preferable and realistic to focus on one segment only. ATF wants to sell a new automated testing framework to IT corporations. There are 106,847 (based on iDataLabs) IT corporations and the average annual income per employee is 1000$. On average, IT corporations spend 40% of their income on tools and QA testers. We are convinced that we will attract 5% market share, as there are already many other similar tools and also other competitors where the corporations go first. What is going to be the potential rand value of this market?

    The size of the market:

  • 1. Number of customer units (1): 106,847 (companies using software testing tools on a global scale)
  • 2. Average annual gross income per unit (2): 1,000$ (for an employee)
  • 3. Total income for area (1 x 2 = 3): 106.847.000
  • 4. Percentage (%) of income spent on item (4): 40% (many IT companies are using QA tools in order to have better releases of the product from sprint to sprint)
  • 5. Potential rand value for item (3 x 4 = 5): 42.738.800
  • 6. Realistic percentage (%) of entrepreneur's market share (6): 5%
  • 7. Rand value of entrepreneur's market share (5 x 6 = 7): 2.136.940

  • Determine the approximate number of players / competitors in your targeted market

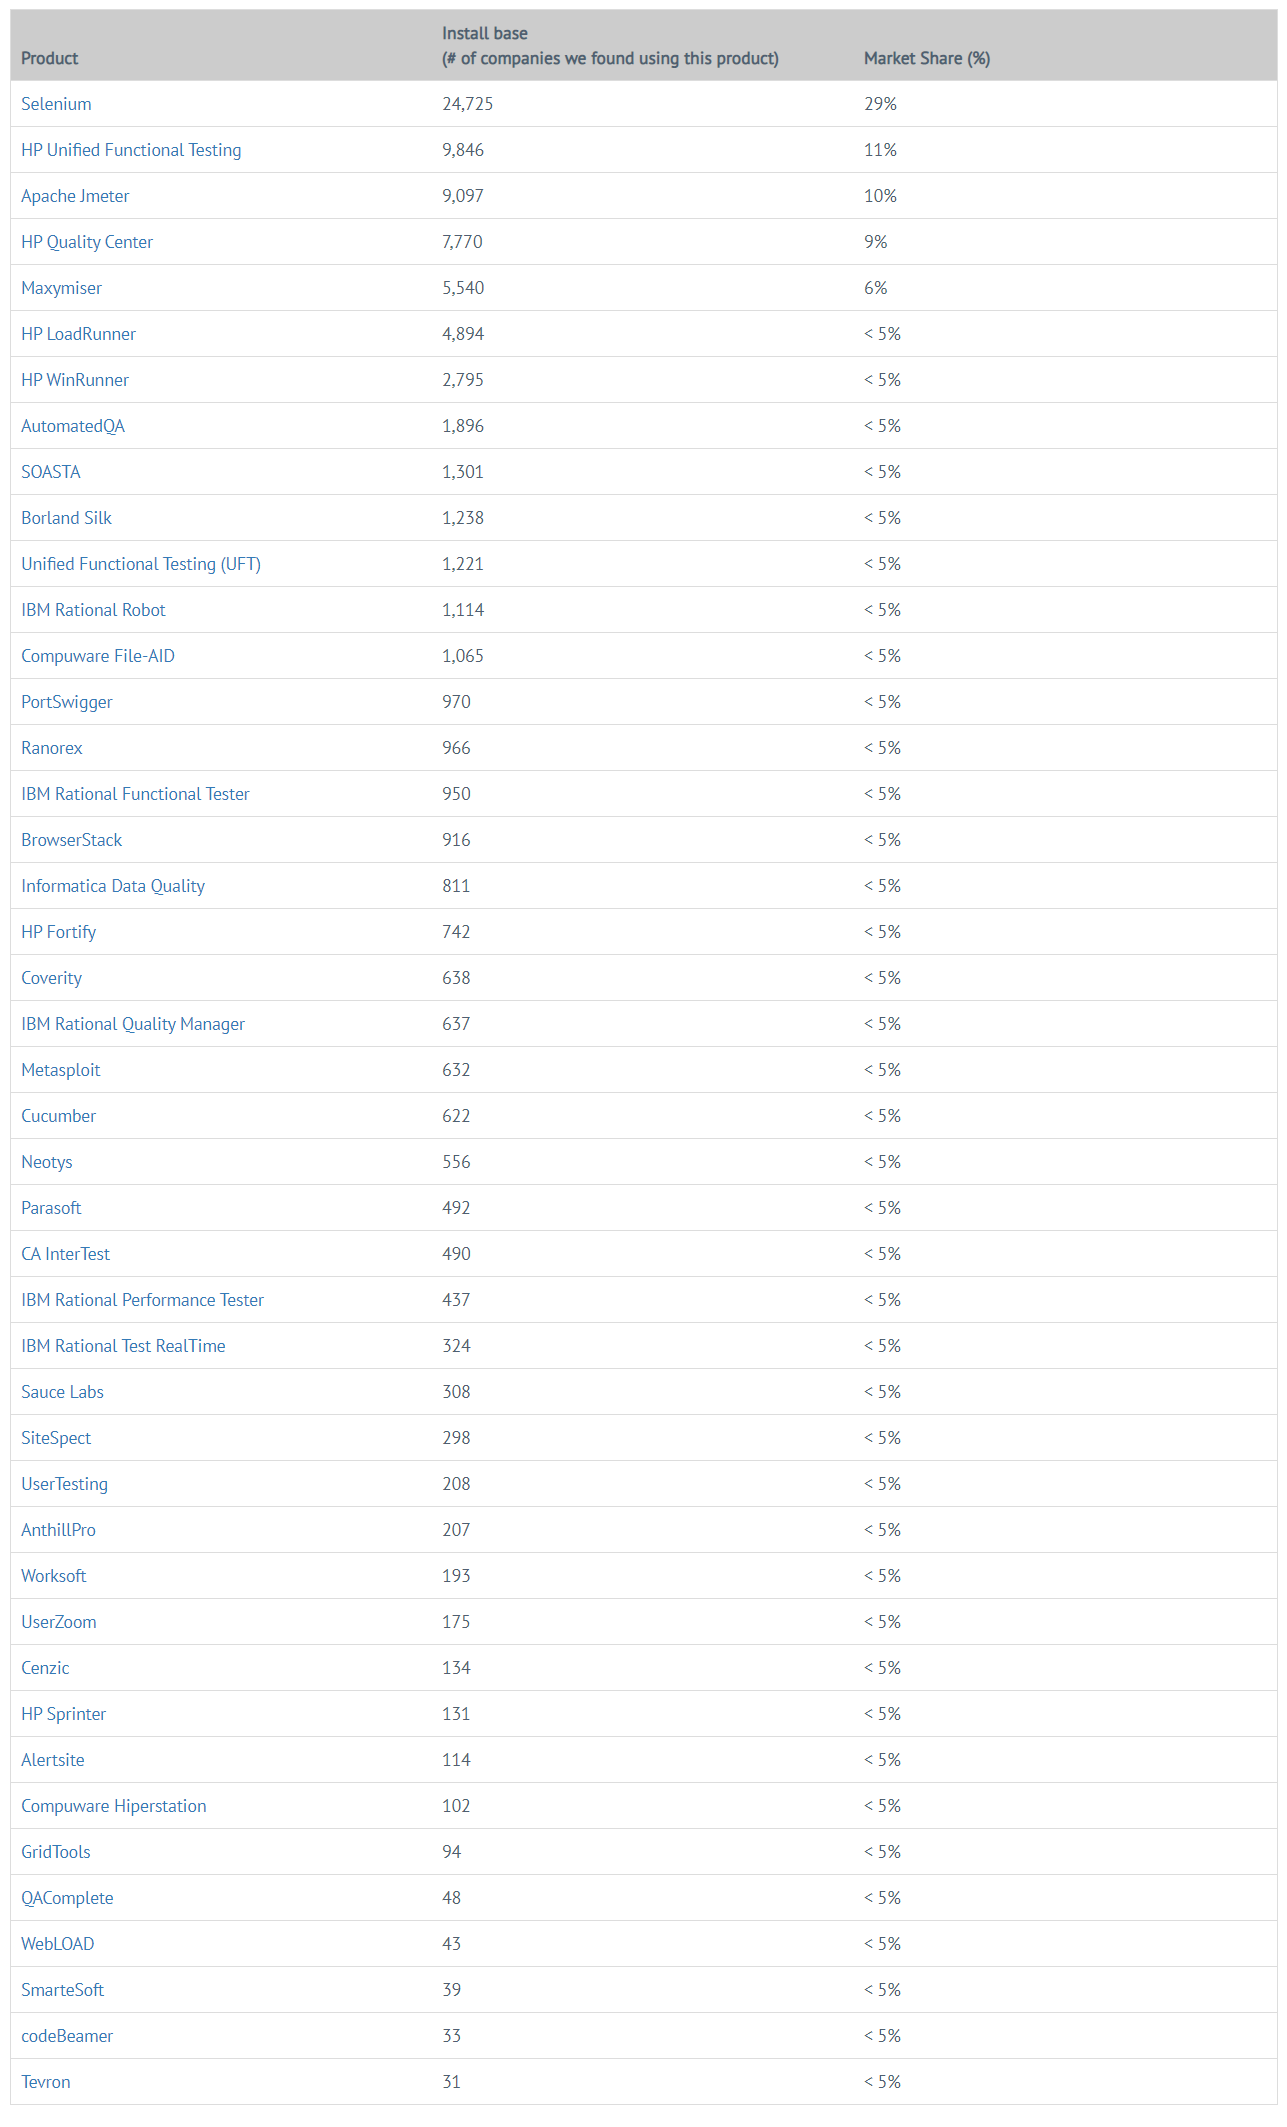
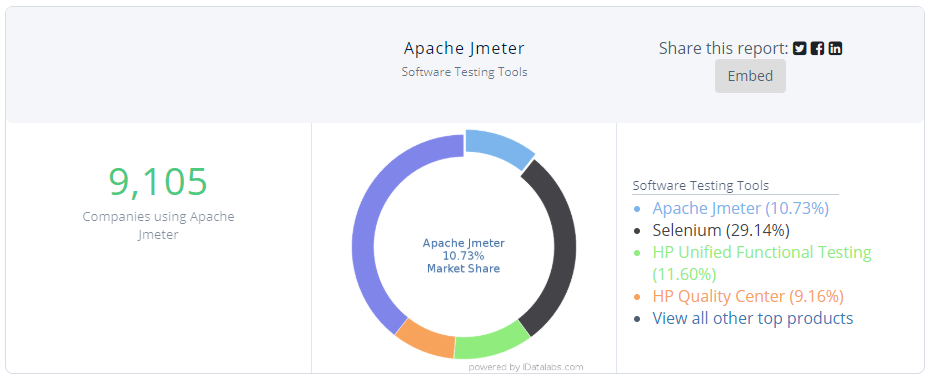
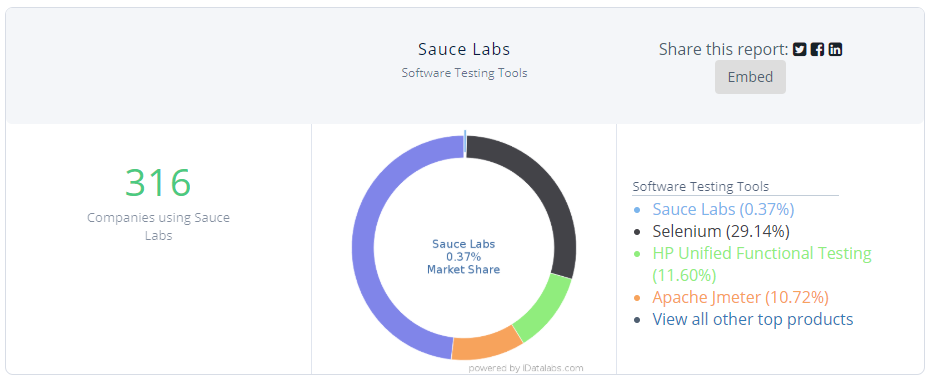
    Market share for competitors


    centered image

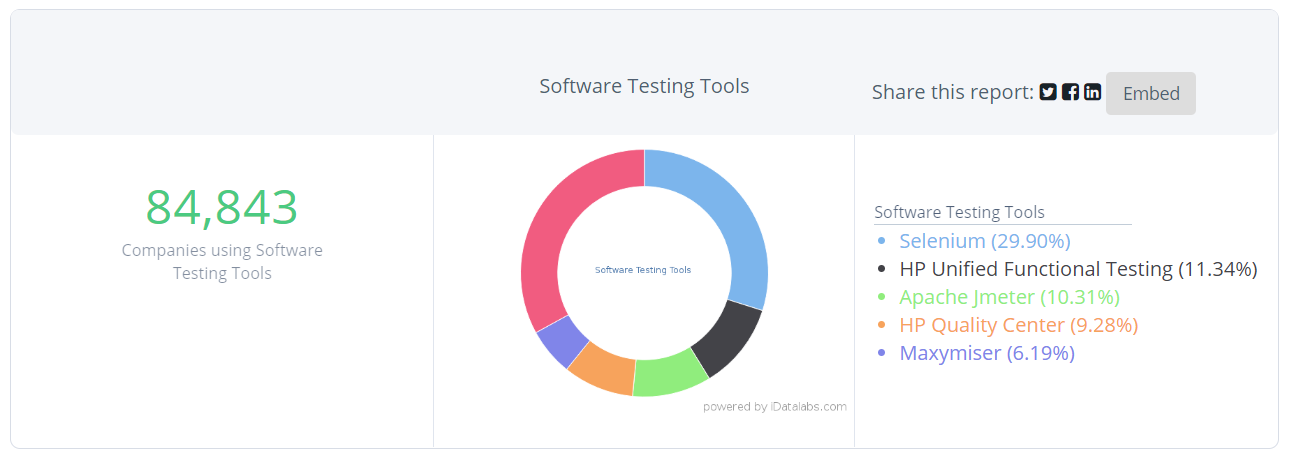
    44 products in the Software Testing Tools category + 84,843 companies using these products


    Considering the large number of competitors we can conclude that launching on the market will be difficult, but we are confident that our feature choices will convince a consistent number of people to choose our product.

    We used: BizBuySell & BizQuest to check which to determine how much businesses are selling for in our industry.

    centered image


    Present the competition and if possible market share for each competitor

    From the 44 software testing tools, we chose the most important 3 tools to analyse:

    BrowserStack


  • BrowserStack is a cross-browser testing tool which allows users to test websites in 700+ desktop and mobile browsers, with pre-installed developer tools.

  • Price: $12.50/month/user.

  • 916 of companies use BrowserStack

  • Market Share is < 5% (~ 1,1%)

  • List of the top companies using BrowserStack:
  • centered image


    Navigate on the slider below to reveal more information about BrowserStack

    Screenshot

    BrowserStack Market Share and Competitors in Software Testing Tools

    In the Software Testing Tools category, BrowserStack has a market share of about 1.1%

    Screenshot

    Top Industries that use BrowserStack

    Computer Software (30%), Information Technology and Services (7%) and Staffing and Recruiting (6%) are the largest segments

    Screenshot

    Top Countries that use BrowserStack

    55% of BrowserStack customers are in United States and 15% are in United Kingdom

    Screenshot

    Distribution of companies that use BrowserStack based on company size (Employees)

    29% are small (<50 employees), 42% are medium-sized and 25% are large (>1000 employees)

    BrowserStack versus ATF


  • Doesn't have the ability to write tests and save them in the platform. It gives you the opportunity to run tests locally (you have them stored locally & run on their infrastructure, but the test code itself it's on your computer).

  • BrowserStack tends to be rather expensive and the free option is very limited. I'd like to see a unlimited free option if even for one person.

  • No faster response times on bringing in the site screenshots.

  • Doesn't have the ability to test multiple browsers at the same time.

  • Can run only one site at a time. It's not very flexible to switch from one page/site to another. Have to restart the view each time.

  • Solution? ATF


    centered image

    Apache Jmeter


  • Apache JMeter is an Apache project that can be used as a load testing tool for analyzing and measuring the performance of a variety of services, with a focus on web applications.

  • Price: $19.00/month/user.

  • 9,105 of companies use Apache JMeter

  • Market Share is 10,7%

  • List of the top companies using Apache Jmeter:
  • centered image


    Navigate on the slider below to reveal more information about Apache JMeter

    Screenshot

    Apache JMeter Market Share and Competitors in Software Testing Tools

    In the Software Testing Tools category, Apache Jmeter has a market share of about 10.7%

    Screenshot

    Top Industries that use Apache JMeter

    Computer Software (30%) and Information Technology and Services (14%) are the largest segments

    Screenshot

    Top Countries that use BrowserStack

    45% of Apache Jmeter customers are in United States, 7% are in United Kingdom and 7% are in India

    Screenshot

    Distribution of companies that use Apache Jmeter based on company size (Employees)

    26% are small (<50 employees), 45% are medium-sized and 25% are large (>1000 employees)

    Apache Jmeter versus ATF


  • Reporting and graph visualization aren't that great. The option of adding external plugins for reporting does enhance it to some extent but not anywhere what we can get from Industry standard tools.

  • Overall look to the modern like interface should be improved.

  • More real world examples to help with learning the product.

  • Recording of tests is very complex for a user with less programming skills.

  • Documentation is not user-friendly, you may need quite an extensive amount of time to resolve an issue.

  • Solution? ATF


    centered image

    Sauce Labs


  • Sauce Labs is a cloud-based platform for automated testing of web and mobile applications. Access web browsers, mobile emulators and simulators, and real mobile devices.

  • Price: $19.00/month/user.

  • 316 of companies use Sauce labs

  • Market Share is < 5% (~ 0,4%)

  • List of the top companies using Sauce Labs:
  • centered image


    Navigate on the slider below to reveal more information about BrowserStack

    Screenshot

    Sauce Labs Market Share and Competitors in Software Testing Tools

    In the Software Testing Tools category, Sauce Labs has a market share of about 0.4%

    Screenshot

    Top Industries that use Sauce Labs

    Computer Software (35%), Staffing and Recruiting (11%) and Information Technology and Services (10%) are the largest segments

    Screenshot

    Top Countries that use Sauce Labs

    72% of Sauce Labs customers are in United States and 8% are in United Kingdom

    Screenshot

    Distribution of companies that use Sauce Labs based on company size (Employees)

    22% are small (<50 employees), 41% are medium-sized and 32% are large (>1000 employees)

    Sauce Labs versus ATF


  • Usually, the platform becomes unresponsive and tests fail without any significant reason.

  • The tests should be a little faster since the time for the tests to complete is a bit slow.

  • Cloud service is a bit sluggish. When run it, it takes a substantially long period of time to finish executions. It is bit sluggish and took at some point to carry out action.

  • No integrated CI system. Doesn't provide a mechanism to run tests on a schedule or integrate with GitHub.
  • Solution? ATF


    centered image

    Estimate your potential market share in year 1, 2, 3, 4 and 5 after launch + Determine the total market value and the value of your market share for years 1, 2, 3, 4, 5

    Market share in 5 years


    The following information is based on the predicted market growth of the Automated Testing industry as presented Here

    (Global Automation Testing Market 2018-2023: Expected to Grow at a CAGR of 17.7% During the Forecast Period to Reach $19.27 Billion)

    (1) Market size in year 1

  • Market size in year 1 = $8.5b
  • Forecasted growth = 17.7%
  • Market size in year 2 = $8.5b x 1.03 = $8.75
  • (2) Market Growth between 2018 and 2022 (5 years)

  • Market size in 2018 = $8.5b
  • Market size in 2019 = $10.02b
  • Market size in 2020 = $11.8b
  • Market size in 2021 = $13.9b
  • Market size in 2022 = $16.35b
  • Market Growth = ($16.35b - $8.5b)/$8.5b x 100 = 92%
  • (3) Market Share in 2018

  • Market Size in 2018 = $8.5b
  • ATF predicted Sales = $50k
  • Market Share = $50,000 / $8.5b x 100 = 0.0006%
  • (4) Market Share in 2019

  • Market Size in 2019 = $10.02b
  • ATF predicted Sales = $500k
  • Market Share = $500,000 / $10.02b x 100 = 0.005%
  • (5) Market Share in 2020

  • Market Size in 2020 = $11.8b
  • ATF predicted Sales = $1m
  • Market Share = $1,000,000 / $11.8b x 100 = 0.0085%
  • (6) Market Share in 2021

  • Market Size in 2021 = $13.9b
  • ATF predicted Sales = $5m
  • Market Share = $5,000,000 / $13.9b x 100 = 0.036%
  • (7) Market Share in 2022

  • Market Size in 2022 = $16.35b
  • ATF predicted Sales = $20m
  • Market Share = $20,000,000 / $16.35b x 100 = 0.12%